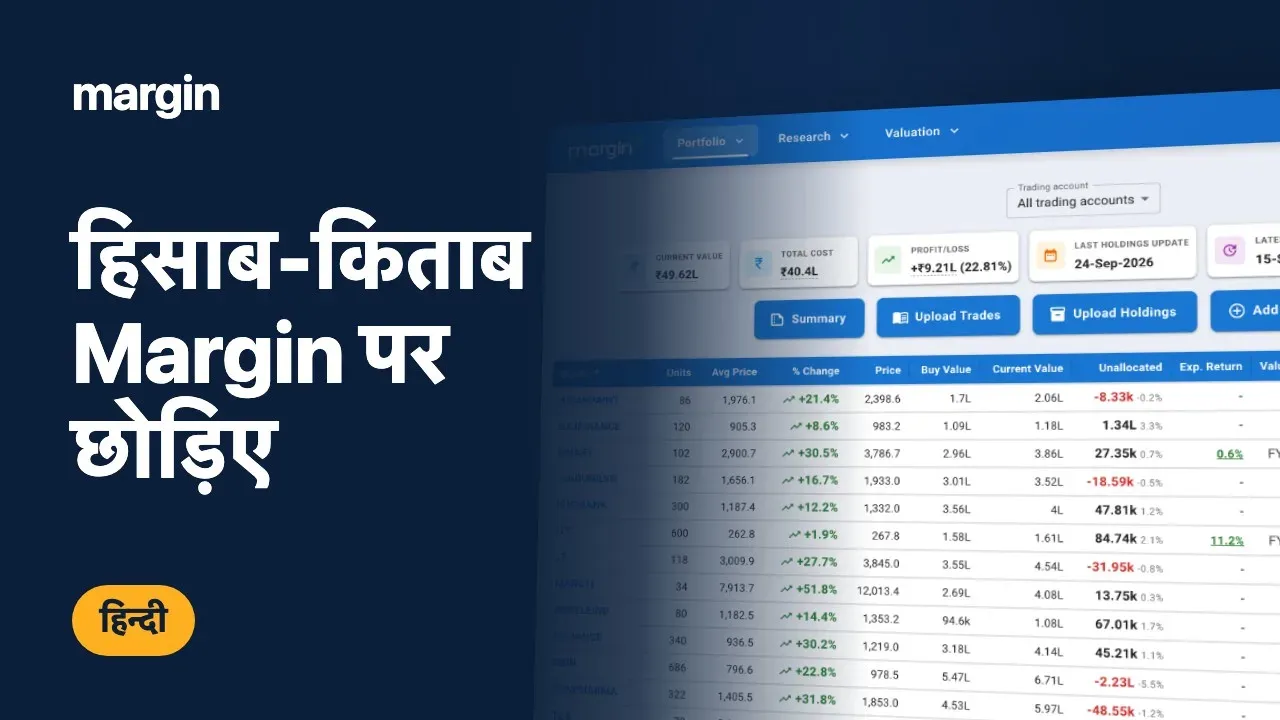
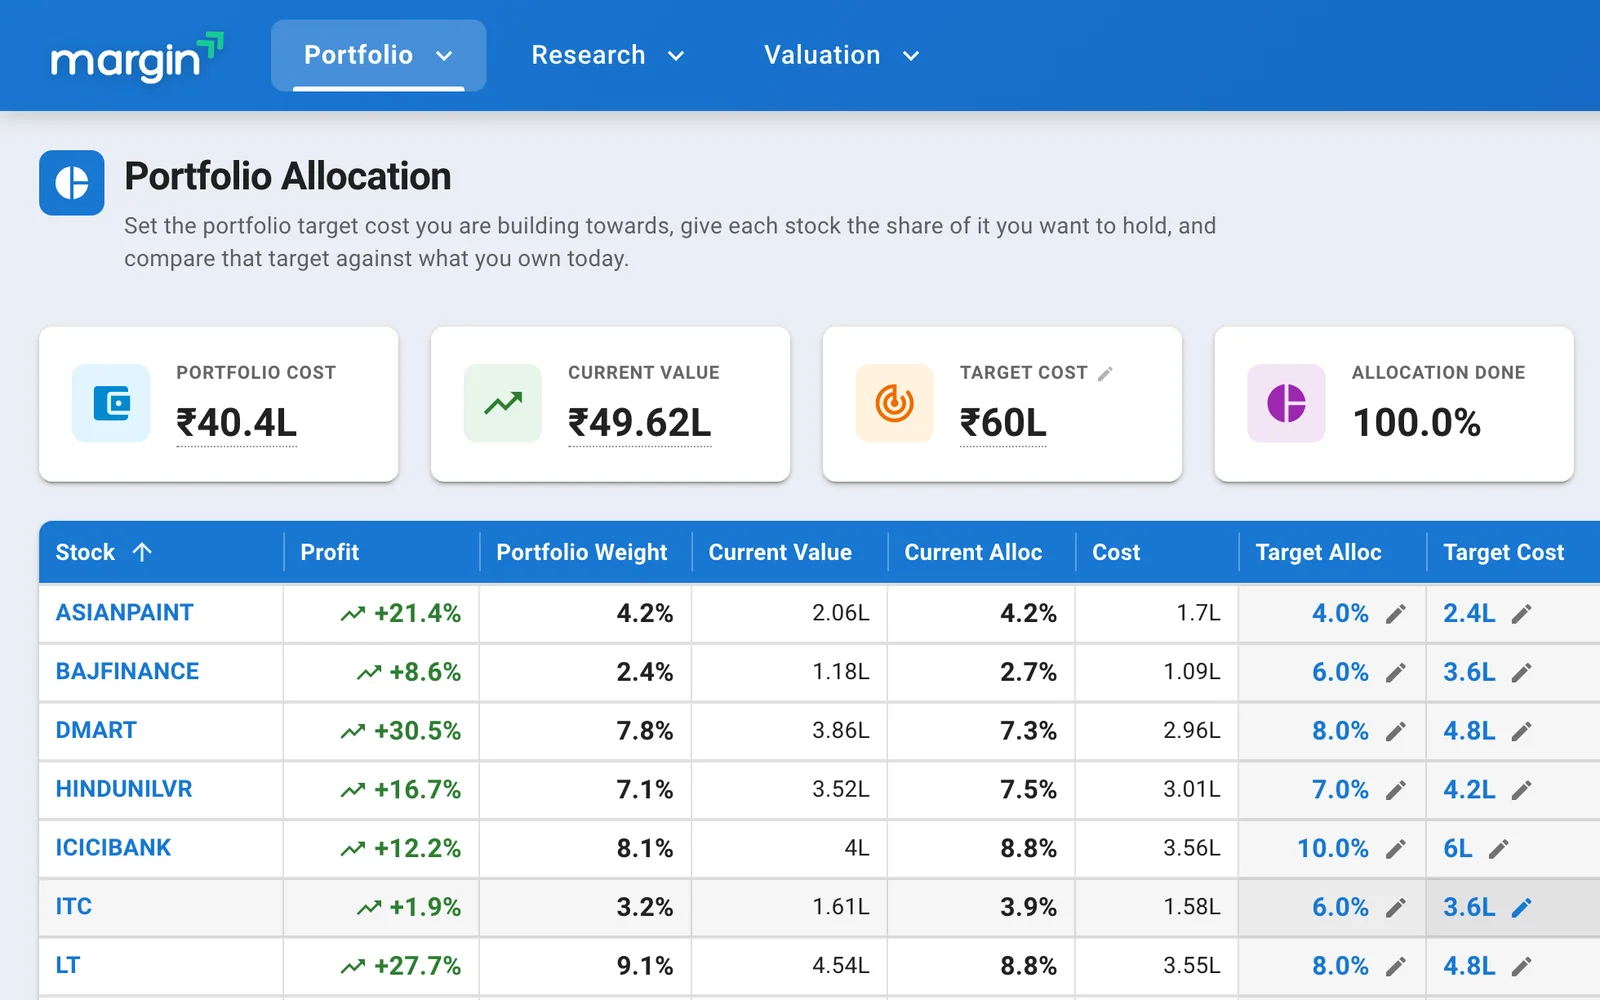
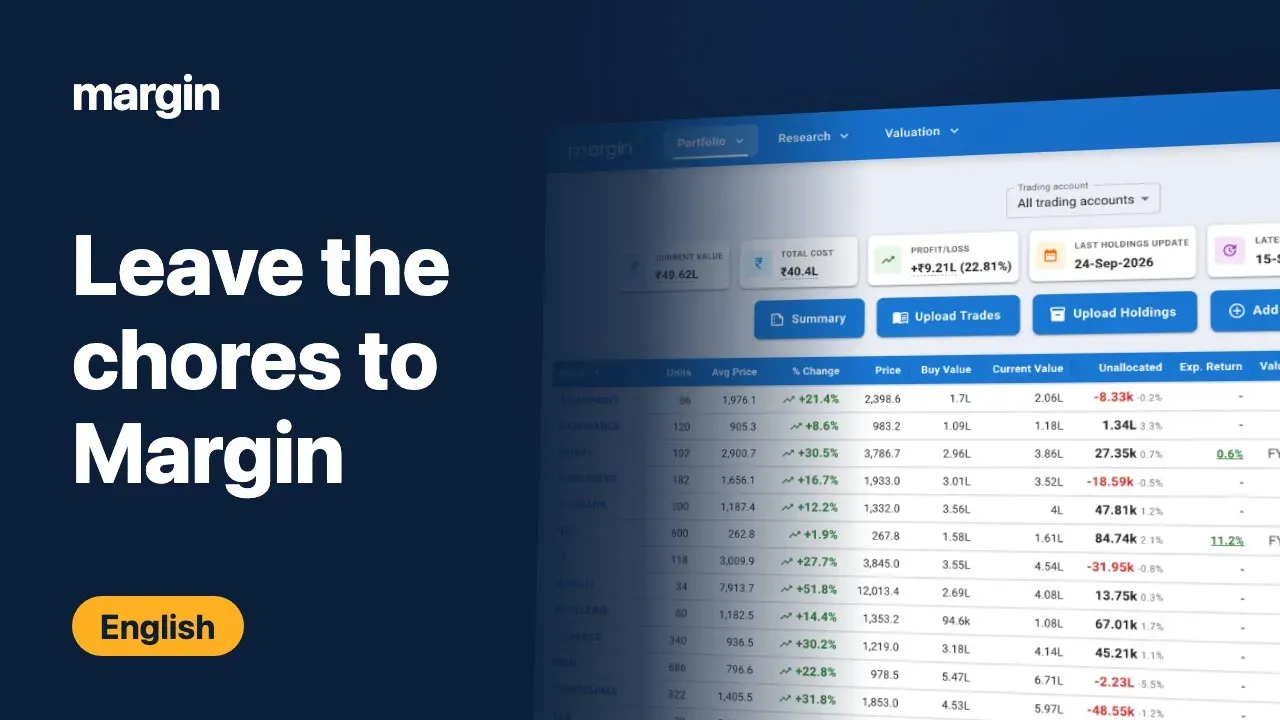
Margin keeps your books and keeps your valuations, allocation and target prices in order, so the decisions are all that's left to you. Your AI agent works from the same data.
Margin in two minutes
Holdings and trades from
Why Margin
The problem
Whether to buy, hold, add or sell depends on what a stock’s valuation says at today’s price, and the price moves every day. With the DCF in a spreadsheet, the price in the broker app and the stock list somewhere else, you stitch the three together by hand. A stock bought for a 15 percent expected return may offer only 6 percent after a sharp rally, with nothing about the business changed, and it looks the same as a holding that is still working.
How Margin solves it
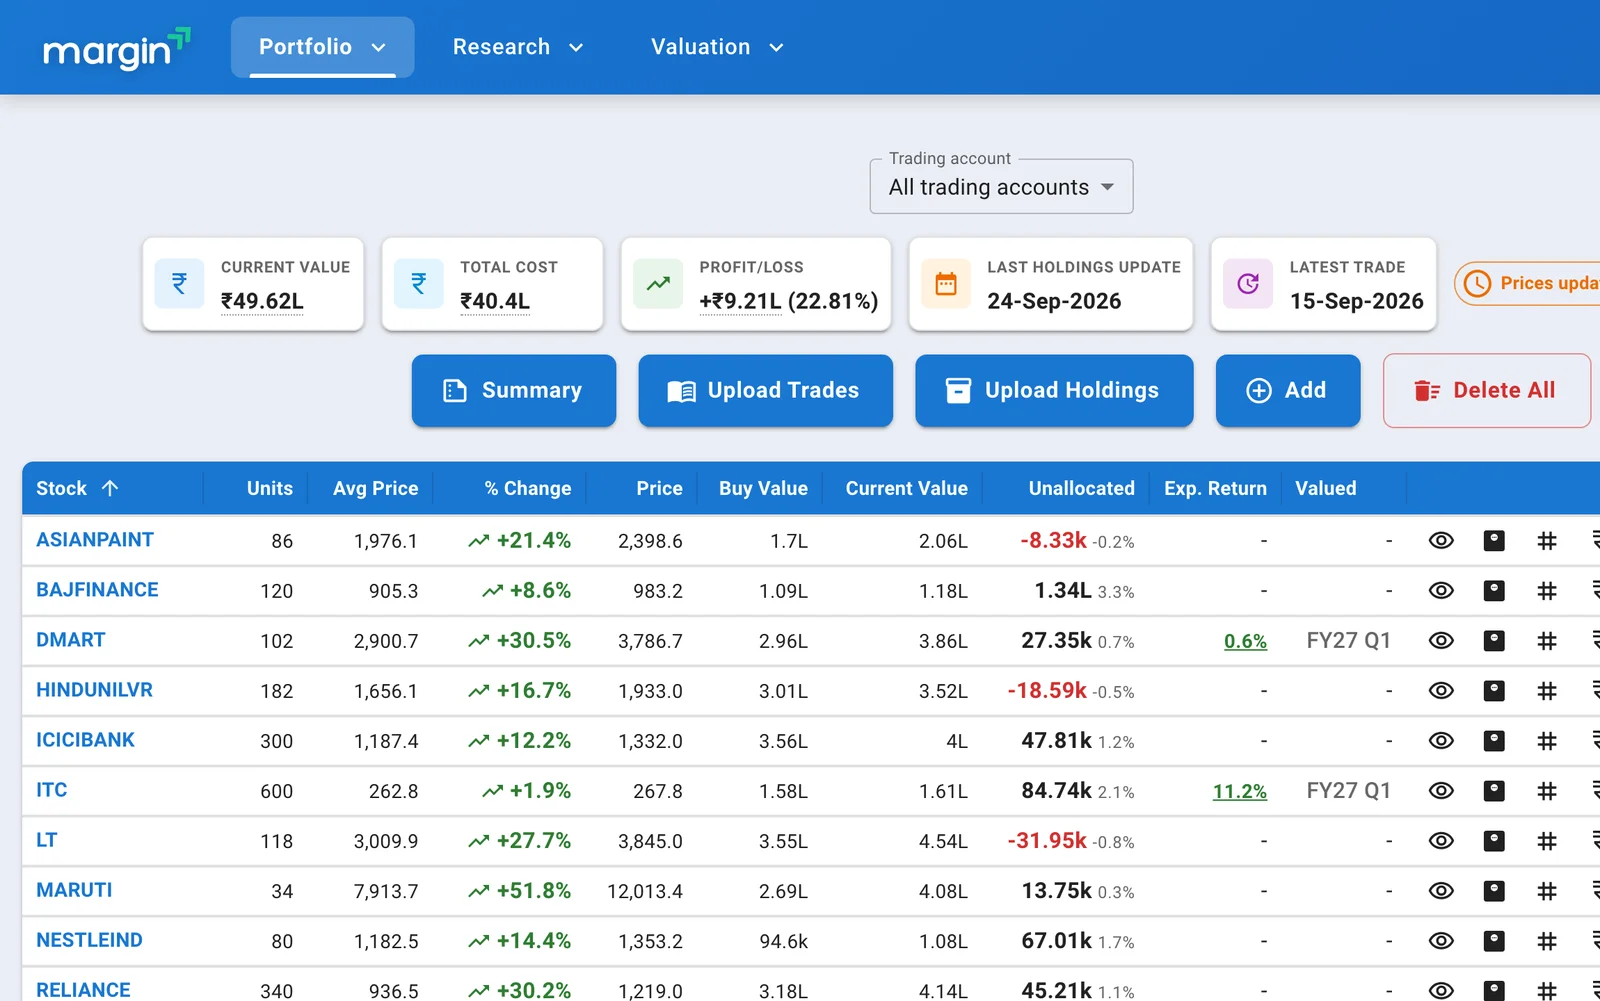
Margin keeps your holdings, your stock lists and a saved DCF for each stock together and reads them against the latest price. The dashboard shows the expected return each valuation implies today beside the Buy, Add, Reduce or Exit prices you set.
Workflow
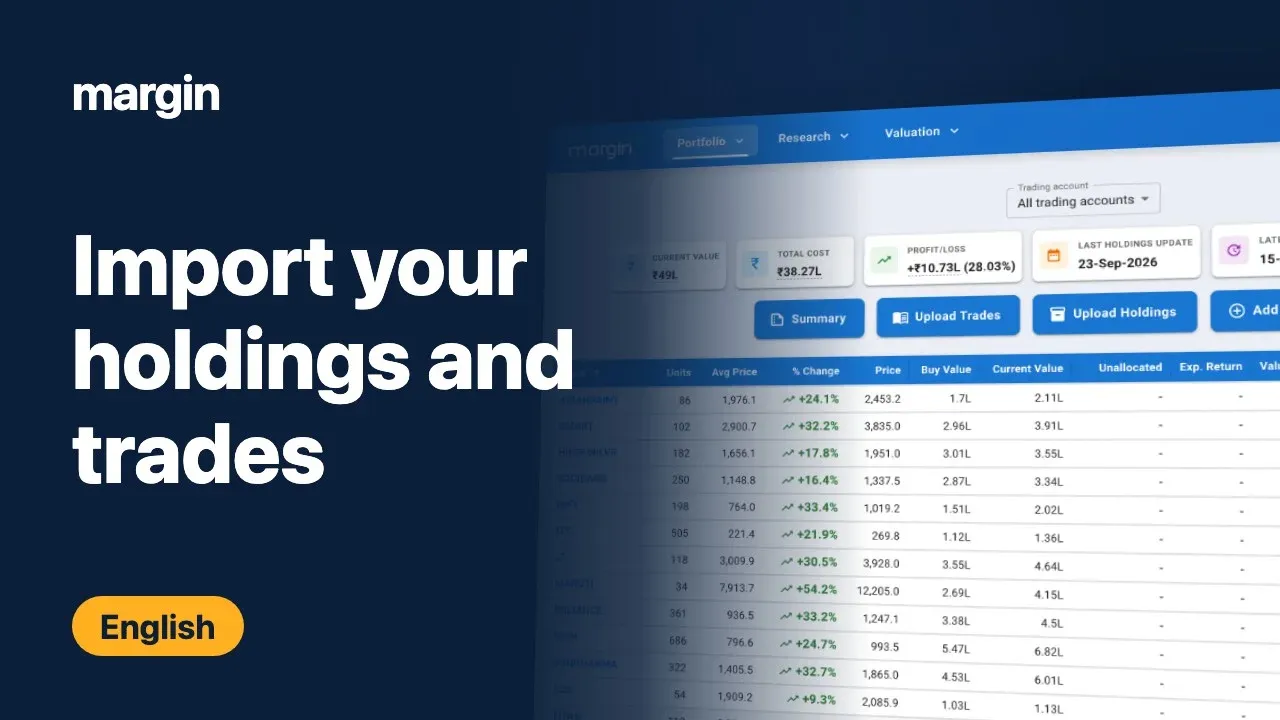
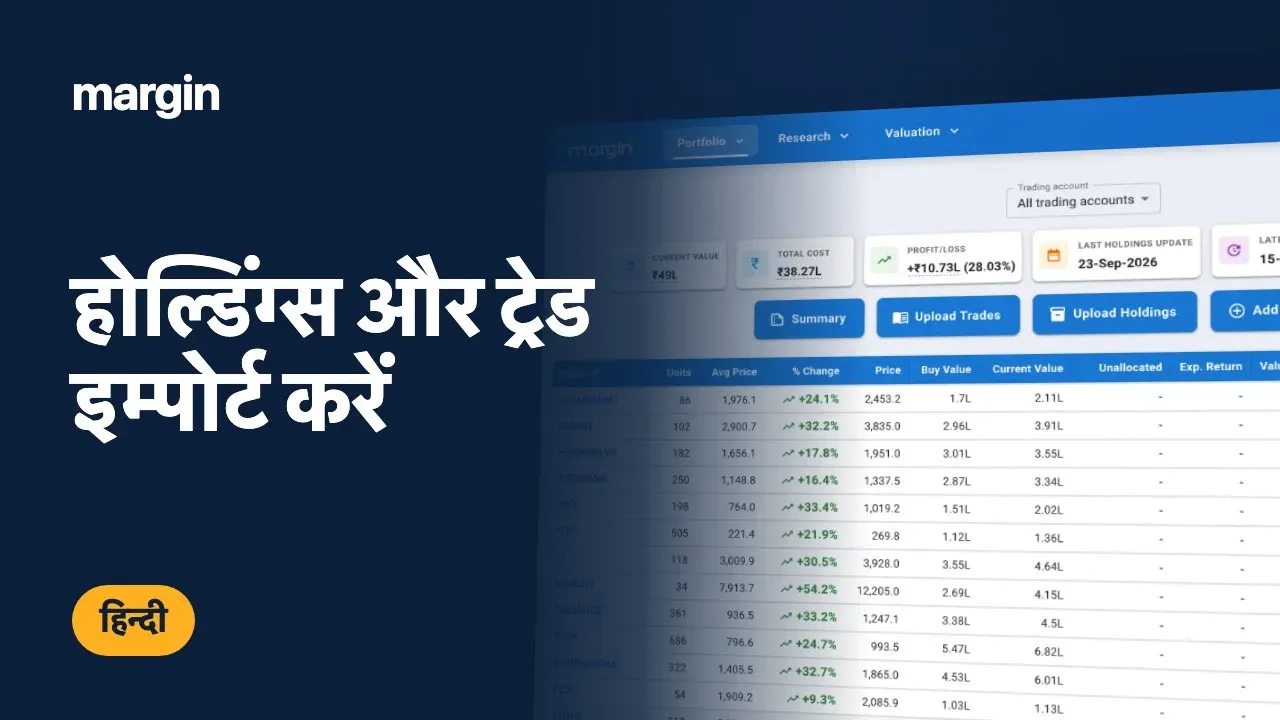
Pick the trading account, then upload its holdings and tradebook from Zerodha, Groww, Upstox or AngelOne, or from any other broker through the generic CSV layout. The dividend statement and the funds statement come in as uploads of their own, and the consistency check names any split or bonus the tradebook never recorded before you trust a return.
Several accounts, across brokers, read as one portfolio
Video walkthrough
API & AI Agents
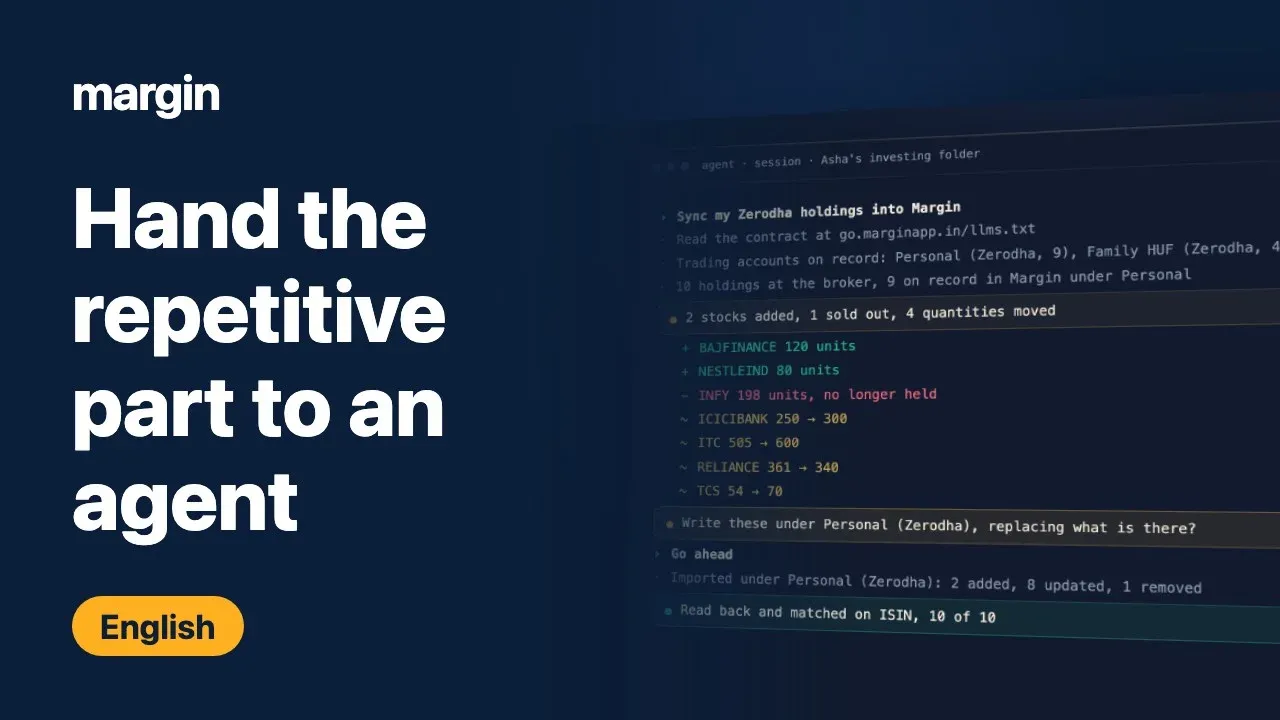
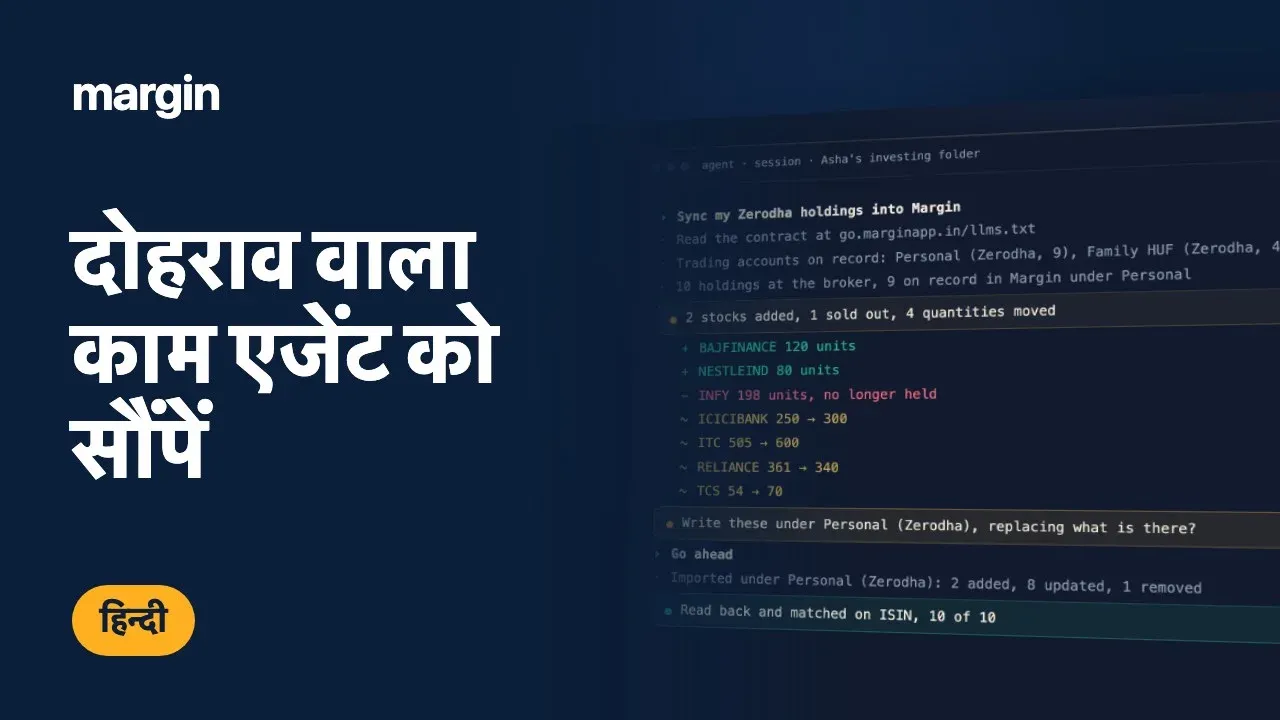
Create an API token and an AI agent, or any script of your own, can carry the whole bookkeeping side: import holdings and tradebooks, record a year of dividends, send the funds statement, build and name lists, set target allocation, and mark a stock studied, tracked or rejected as you screen.
It can do the valuation work too. An agent can compute a DCF from assumptions you give it, solve a reverse DCF for the growth the current price implies, save a forward projection against a stock, and move that projection to another quarter. Publishing a stock story video to YouTube runs through the same token.
Agents read their instructions from a machine-readable llms.txt
that spells out what each upload replaces and what it leaves alone, so a skill works against the
current contract rather than a copy of it. The recipes page sets out exactly what a token can
read, what it can write, and what stays closed to it.
# point your agent at
go.marginapp.in/llms.txt
Authorization: Bearer mgn_••••••••
POST /web/stockOfInterest/upload/json
POST /web/dividends/upload/csv
POST /web/fundsLedger/upload/json
POST /web/projection/dcf
DCF Valuation
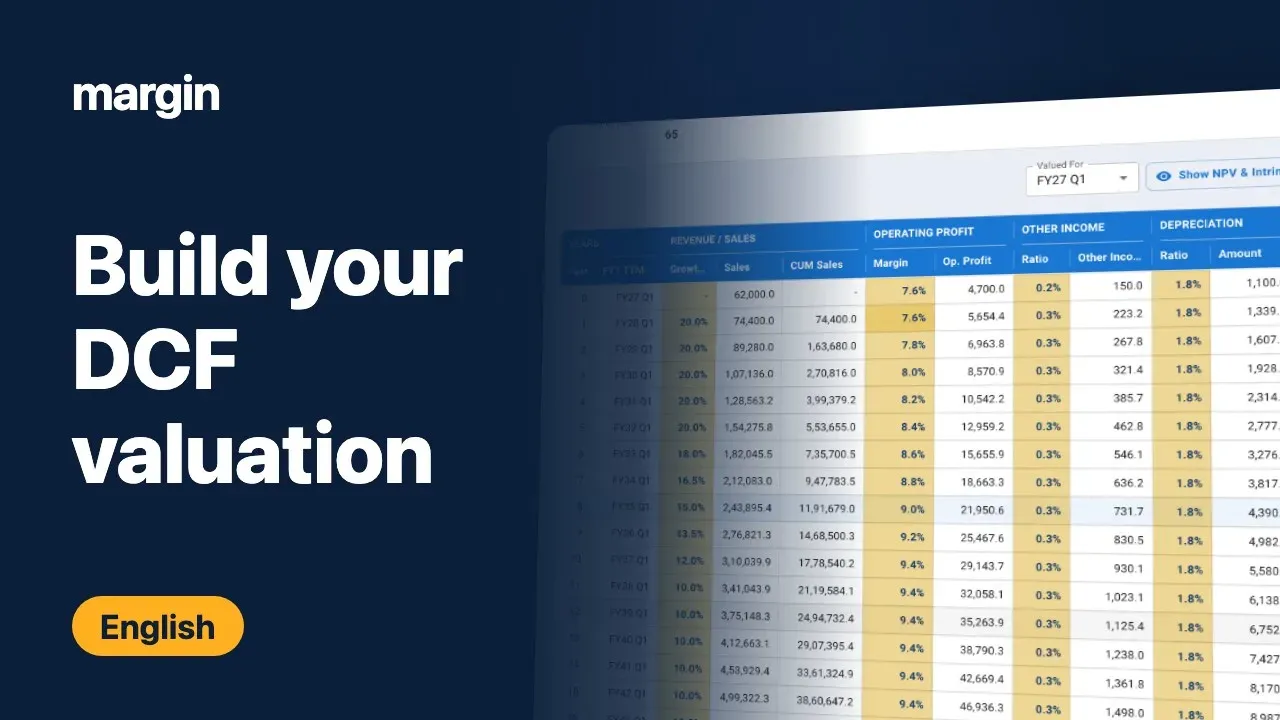
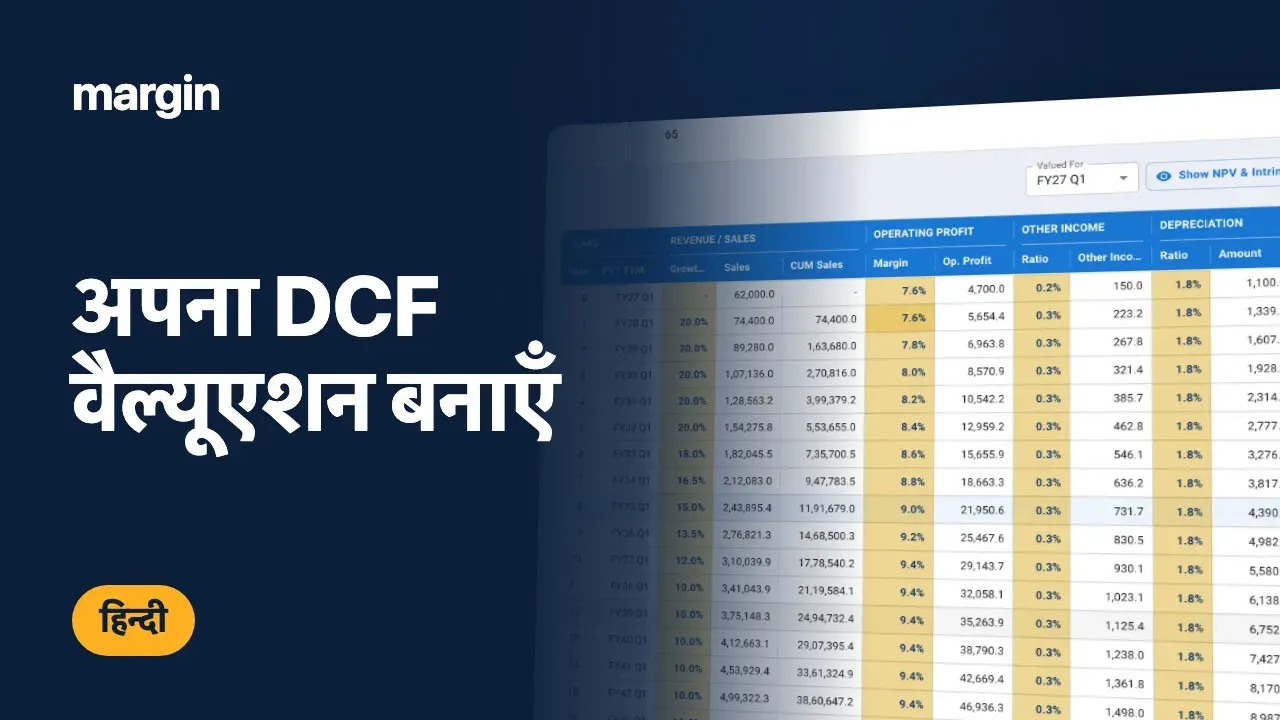
DCF in Margin lets you build a full financial model, projecting revenue growth, operating margins, depreciation, tax, capex and working capital year by year. Discount the resulting free cash flows back to today for an intrinsic value, and read it against the market price to decide whether the stock is worth buying, holding, or leaving alone.
Fill a ratio down the projection years with a drift per year in basis points instead of typing each cell. Keep your own reference ratios beside the model, so the multiple or margin you judge a business by is on screen while you set the assumption. Attach a note to the valuation recording what you were underwriting and why.
A what-if price lets you override the quote, by an amount or by a percentage, and watch enterprise value, market cap and the summary move with it, without that price being saved into the valuation. Every valuation stays anchored to the quarter it was valued for, so a number you look at a year later still tells you what it was built on.
DCF Model Inputs
Revenue Growth Rate
Filled down, −50 bps a year
Operating Margin
Stabilising assumption
Discount Rate
Market cap ₹18,400 Cr
Reference Ratios
Intrinsic value per share, valued for Q1 FY 2026-27
₹1,840
Against the quoted ₹2,340, a 22% premium to fair value
Reverse DCF
Reverse DCF starts from the price. Enter the earnings per share and Margin divides the price by it for the PE you would be buying at. Add the holding period you have in mind, the PE you expect to sell at and the earnings growth you believe in, and Margin works out the yearly return you would earn buying at that price.
State the growth as a yearly rate, or as the EPS or profit you expect at the end of the period, and Margin converts between them. When the return falls short of what you want from the stock, the price already asks for more growth than you are prepared to assume.
Try Reverse DCFReverse DCF Calculator
Holding period
How long you intend to hold
Current PE
Today's price over the EPS you enter
Exit PE
What you expect to sell at
EPS growth
A year, or the EPS or profit you expect in year five
Annualised return
10.0%
A year, for the five years you hold it, if the growth and exit PE hold
Returns & Tax Summary
XIRR (annualised)
21.3%
Absolute return
18.6%
Opening value
₹18.2L
Closing value
₹24.1L
Gain breakdown, current FY
Returns & Tax
XIRR accounts for every buy, sell and dividend on the date it happened. Margin runs it over the period you pick: since inception, a trailing stretch of 1, 2, 3 or 5 years, a calendar year, or a financial year. Ask it of one stock, of any list, or of the whole portfolio, alongside the absolute return, the gain, and the opening and closing value of the period.
Where a period cannot yield a rate, Margin says which period and why: nothing was held or traded, there is no closing price on the period start to value the opening position, or the cash flows never turn around inside the period, and the rate is left blank for that period.
On sales it separates short-term from long-term capital gains and applies the rate that was in force on the date of the sale, so a sale from years ago is taxed at the rate of its own year and not today's.
Net Investment
Upload the funds statement your broker gives you and Margin reads the cash that moved between you and the market. It reports money in, money out, how much you are net invested, and what that has averaged a year.
From the same record it computes a money-weighted return, valuing your holdings today against every deposit and withdrawal on the date it happened. XIRR tells you what your capital earned while it sat in particular stocks, while the money-weighted return accounts for when you put the money in. Margin shows both figures, each labelled, and neither replaces the other.
Cash lying idle with the broker is not in the rate, because the statement carries no balance Margin keeps, so the figure is understated by whatever you have left uninvested. Totals begin at the earliest year you upload, and Margin names any year missing in between.
Zerodha statements are read as downloaded. Other brokers go in through a generic column mapping.
Funds Statement
Money in
₹51.2L
38 deposits
Money out
₹8.6L
5 withdrawals
Net invested
₹42.6L
Put in less taken out
Average a year
₹6.1L
Over 7 years
Money-weighted return
16.8%
01 Apr 2022 to 05 Sep 2026, holdings valued at ₹68.4L today
Dividends On Record
Net received
₹2.41L
Paying stocks
34
Payouts recorded
128
Years covered
7
FY 2019-20 to FY 2025-26
FY 2025-26, most recent payouts
Dividends
Upload the dividend statement for one financial year and Margin keeps a payout per stock per ex-date, with the ex-date held as the day the cash arrived. A stock that paid twice in a year stays two payouts with their own dates.
Each payout then counts as cash returned on that date, in the XIRR of the stock and of the whole portfolio. A year you have not uploaded understates your return by whatever it paid, so Margin shows the years you hold before you read any return as settled.
When a row names a stock Margin cannot match, nothing is written and the year is left as it was. You pick the stock yourself and upload again, so a year is never reported complete while a holding is missing from it.
Zerodha dividend statements are read today. Send yours through the feedback button in the app and the format gets added.
Research Library
Margin builds structured research reports on Indian stocks, covering the business, its financial health, its recent story, how its valuation looks through the cycle, and the industry it competes in.
Don't see a stock you follow? Request it, and you'll be notified inside Margin the moment its research is ready.
Stock Story
Why the business matters, financial health, recent story
Valuation Normalisation
What earnings look like through the cycle
Segment Story
The business broken down segment by segment
Industry Story
Sector dynamics and structural forces
Stock Story
Consumer · NSE
EBITDA margin
18% – 22%
Screen
Flip through a deck of quick stories, each carrying what the company sells, who it competes with, its margin range and its latest revenue. Give a verdict on every one: Yes, Maybe, No, or Never.
Margin remembers your calls and picks up where you left off. Everything you say Yes or Maybe to lands in your Screened list, ready to dig into.
Start screeningData Security
We use Privacy Vault, a secure encrypted store, to protect personally identifiable information like your name and email. Where a regular database would hold those fields in the clear, Privacy Vault locks them with separate encryption keys.
The funds statement gets stricter treatment, because its description column carries your client code, payment references and bank account. Margin reads that file in your browser and sends only the dated amounts, so the file never leaves your machine. Sending the description at all is your choice, and when you do, the server hashes it on arrival and keeps only the hash. No endpoint returns the wording and there is no text search over the ledger.
Who is behind this
Margin asks you to upload the record of your portfolio, so it is fair to want to know who is receiving it. We are a company registered in India with our identification number published on this site, and the terms you sign up under are written out rather than summarised.
Margin is not an advisory service and is not registered as one. It makes no recommendations, sells no tips and takes no view on any stock. Every assumption behind a number it shows you is one you entered.
Reading
Guides take one feature and the investing concept behind it. Insights cover how investing works, and they hold up whether or not you use Margin. Recipes deal with automating the clerical part.
Guides
13 guides
How to bring your broker's holdings export and tradebook into Margin, what each file feeds, the generic CSV layouts for a broker Margin does not read yet, what a re-upload replaces and what it only adds to, and how to read the first errors.
Insights
5 essays
"Market sentiment is like a pendulum, swinging between fear and greed." The quote may be right to some extent, but it is not an incredibly useful metaphor. Investors need a more nuanced model to do well.
Agent recipes
7 recipes
Importing holdings, recording a year of dividends, moving a spreadsheet valuation in. Each recipe ends with a skill you can copy and adapt.
Questions
No. You download holdings, trades, dividends and the funds statement from your broker and upload them, and Margin never asks for a broker login or holds one. If you would rather not do that by hand, you can create an API token and point an agent of your own at it, and even then your broker credentials stay on your machine.
No. Prices come from the NSE and BSE end of day files, so they do not move during the session. Margin shows the date of the quote beside any value it reports, and it tells you when a total is missing a stock it has no price for.
Holdings and trades come in from Zerodha, Groww, Upstox and AngelOne as downloaded, and from any other broker through a generic CSV layout. Dividend statements are read from Zerodha today. The funds statement is read from Zerodha as downloaded, and from other brokers through a column mapping you set once.
Yes. Send a file per account and Margin merges them, adding the quantities and averaging the cost by quantity. Each holding still shows the split by broker underneath, and you can ask for returns, gains and allocation one trading account at a time.
No. Margin covers listed equities on NSE and BSE. Everything in it, from the valuation grid to the capital gains rates, is built for that and would be wrong applied elsewhere.
No. There are no recommendations, no target prices of ours and no tips. Margin computes what your own assumptions imply and shows it against the market price, and every anchor on a stock is one you set yourself.
Yes. Holdings, trades, dividends and the funds statement can each be cleared from inside the app, in whole or a year or a broker at a time, and you can delete the account and everything in it. An API token deliberately cannot do any of that.
Pricing
Free
No credit card required.
Margin is free while it is young, and pricing arrives in a few months. We will tell you before any of it takes effect.